Initial Human Rights Censorship Dashboards
Initial development version of Human Rights Censorship Dashboards generated from Citizen Lab test-lists and OONI measurement data

Overview
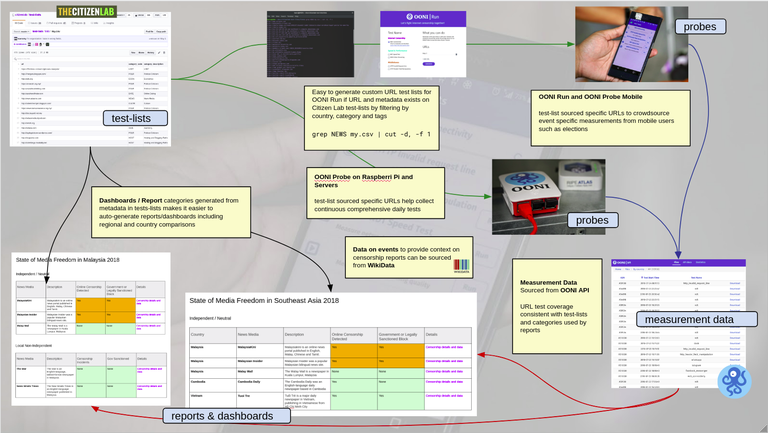
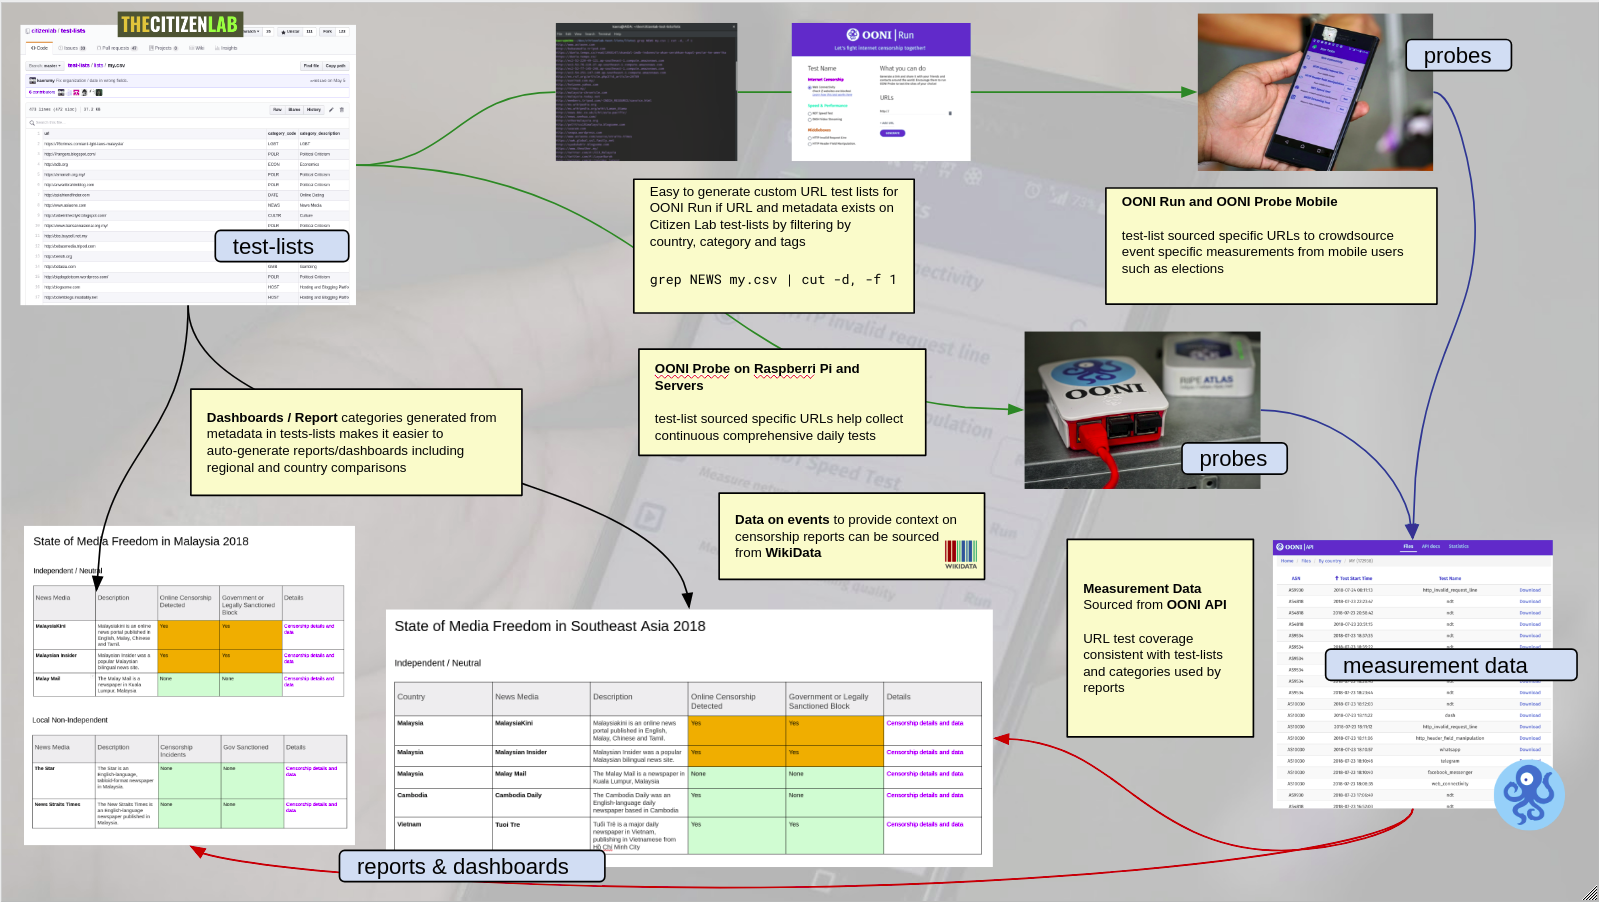
Development of usable dashboards for use of rights researchers was based on the premise of joined up and reuse of Citizen Lab tests-lists and OONI measurements data API. The test-lists provide the urls for testing, but also the source metadata for categories which are of interest to researchers and journalists. The meta-data of the tests lists are also used to automatically generate categories and listings of the dashboards.
These lists are also used by OONI Probes, especially version 2.0 which provdes features for users to specifically set which categories they would like to test. As a result, data collected would be for URLs in the test-lists, providing consistency. Updates to test-lists, would therefore allow the dashboards to be able to generate results for comparisons consistently across all countries and categories that are of interest to researchers and that help maintain the global test-lists.
Initial development version of the dashboard shows the viability of this collaborative and standardised approach.
- Temporary live development dashboard
http://blockornot.today - Future stable development dashboard
https://censorship.sinarproject.org - repository
https://github.com/Sinar/hr-censorship-dashboard
Findings in initial version of dashboard development
- Critical for tests-lists for each country to be comprehensive for all categories and up to date
- Additional meta-data such as description columns will be needed to make the lists easier to adopt and maintain, as well as providing more descriptive information for the dashboard and for analysis by researchers for joined up meta-data of test-lists
- More fingerprints for manually confirmed anomalies to be exposed via OONI API
- Type of anomaly and also confidence level should be exposed via OONI API
- Research on confidence weighting for tests with anomalies to reduce number of false positives in dashboard
Initial Country Overview Dashboard
http://blockornot.today/#/summary/2019

The majority of the Use Cases are researchers writing reports on the state of Internet censorship in general, media freedom, religious freedom, LGBT categories and are interested mostly in yearly overviews and only for confirmed cases of censorship. It is also usually for either a specific country or comparisons for an international index.
At the time of development, due to lack of data on confirmed/fingerprint issues, a count of any site which had anomalies returned by OONI API was added for each category for a country. This is not very helpful for current target users. In the immediate future, only confirmed (fingerprint) results should be shown by default, with all anomalies with enough tests as a toggle/option for the user that’s willing to review.
As a result, the dashboard does not need to pull much data from the OONI API for it to be useful, only for those marked confirmed or as anomalies. This makes this dashboard approach quite scalable internationally in future.
Related upstream issues:
- ooni/api How should we expose anomalies https://github.com/ooni/api/issues/32
- ooni/pipeline Add support for extracting useful "anomaly" information from measurements https://github.com/ooni/pipeline/issues/76
Summaries by Country
http://blockornot.today/#/summary/2019/my

Drilling down, for each country, we can then quickly see overview of which sites by category has had anomalies detected. As in Overall Summary, only measurements flagged as confirmed, or over specific level of anomaly count threshold should be shown here in future versions for users.
When there is no official censorship order such as that in Thailand or Indonesia, then censorship will not be consistent across ISPs. Side by side view of ISPs provide easy summary for researcher review censorship in place across different ISPs. ASN to human readable ISP registrar name translation, and possible UI improvements could be done here for future revisions.

Site Anomaly History and Anomaly Report
Provides the researcher with a more detailed daily view of all anomalies for an ISP by day for the year. To make it useful for the target users, the type of anomaly confirmed and basic explanation as currently provided in OONI Explorer Page and Probe should be added in future versions of the dashboard.
Anomaly Report also pulls in Wikidata listings of notable events on the day for that country, to aid researchers such as elections, special holidays, protests etc. This feature again is with aim of making the dashboard light and scalable by depending on upstream data.
Related upstream issues
- ooni/api How should we expose anomalies https://github.com/ooni/api/issues/32

Measurement Data and Test Lists
Since the OONI Probe App sources urls from Citizen Lab test-lists, it is essential that it is constantly updated. To ensure this happens, there should at least be a maintainer or civil society focal point for each country that coordinates with civil society and media to ensure that all urls of identified as of interest for these groups are there in the country specific lists.
While the OONI mobile app, can help collect far more diverse set of measurements, it requires quite a large number of users to collect enough data consistently for all URLs with default settings. A command line OONI Probe application that can be installed easily on a server or cheap computers such as Raspberry Pi that runs all tests daily at one or a few installations per country will ensure consistent and comprehensive set of daily tests.
With enough measurement data, consistent categories and quick overview of sites blocked provided by dashboard, Sinar Project could quickly write insightful report on types of Malaysian laws being used to block different categories of websites. Example template reports using OONI API data in Jupyter notebooks could also be explored for data journalists as an example of using OONI measurement data for reporting.
Next Steps
The current dashboard will will eventually be moved to permanent url of censorship.sinarproject.org and will continue to be a test bed for visualization of OONI API data and Citizen Lab test-lists metadata. Data for Thailand and Philippines will be added, and improvements to upstream data will be merged. Hopefully fixes and ideas from this dashboard, will also benefit other projects planning to use OONI API and citizen-lab tests lists.
When data via API and metadata is at the stage where it becomes useful for researchers, a possible UI revamp of this dashbaoard might be warranted, but it would also mean that upstream data and metadata are good enough for enabling environment for development of other custom dashboards and data driven reports.
