Open Data Day 2016: Data Expedition
Measuring Provision of Public Services for Education
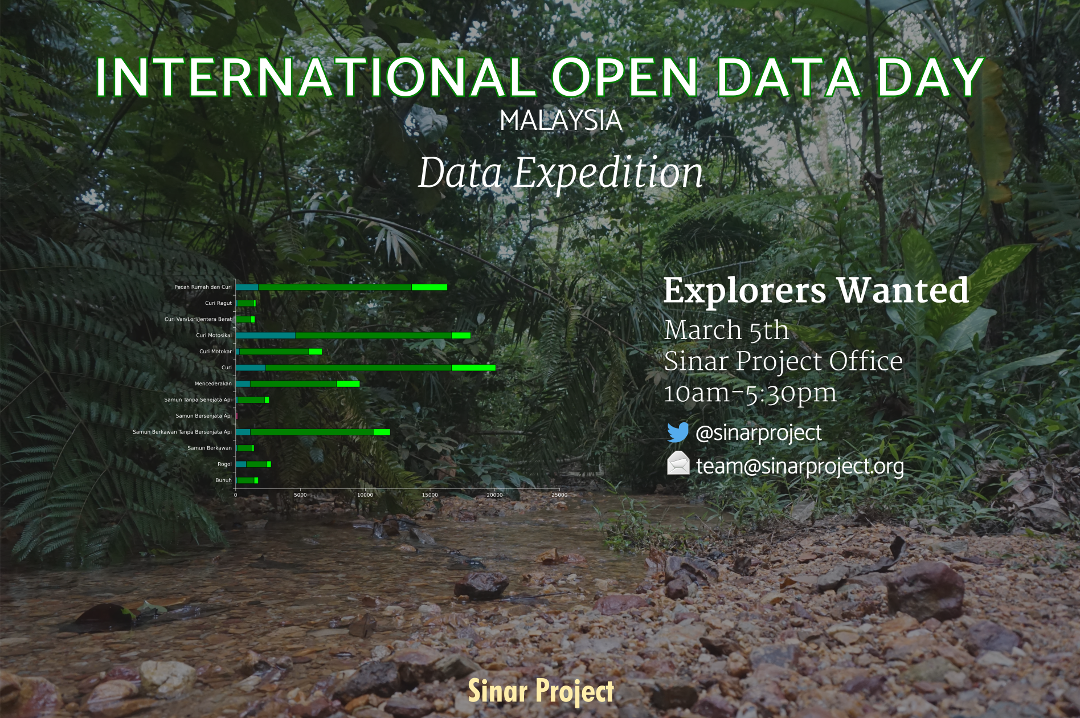
In Malaysia, Sinar Project with the support of OKFN organized a one day data expedition based on the guide from the School of Data to look for data related to government provisioning of health and education services. This brought a group with diverse skills to ask questions of public interest, to look for data and to analyse and visualize the data to try find the answers.
Data Expedition
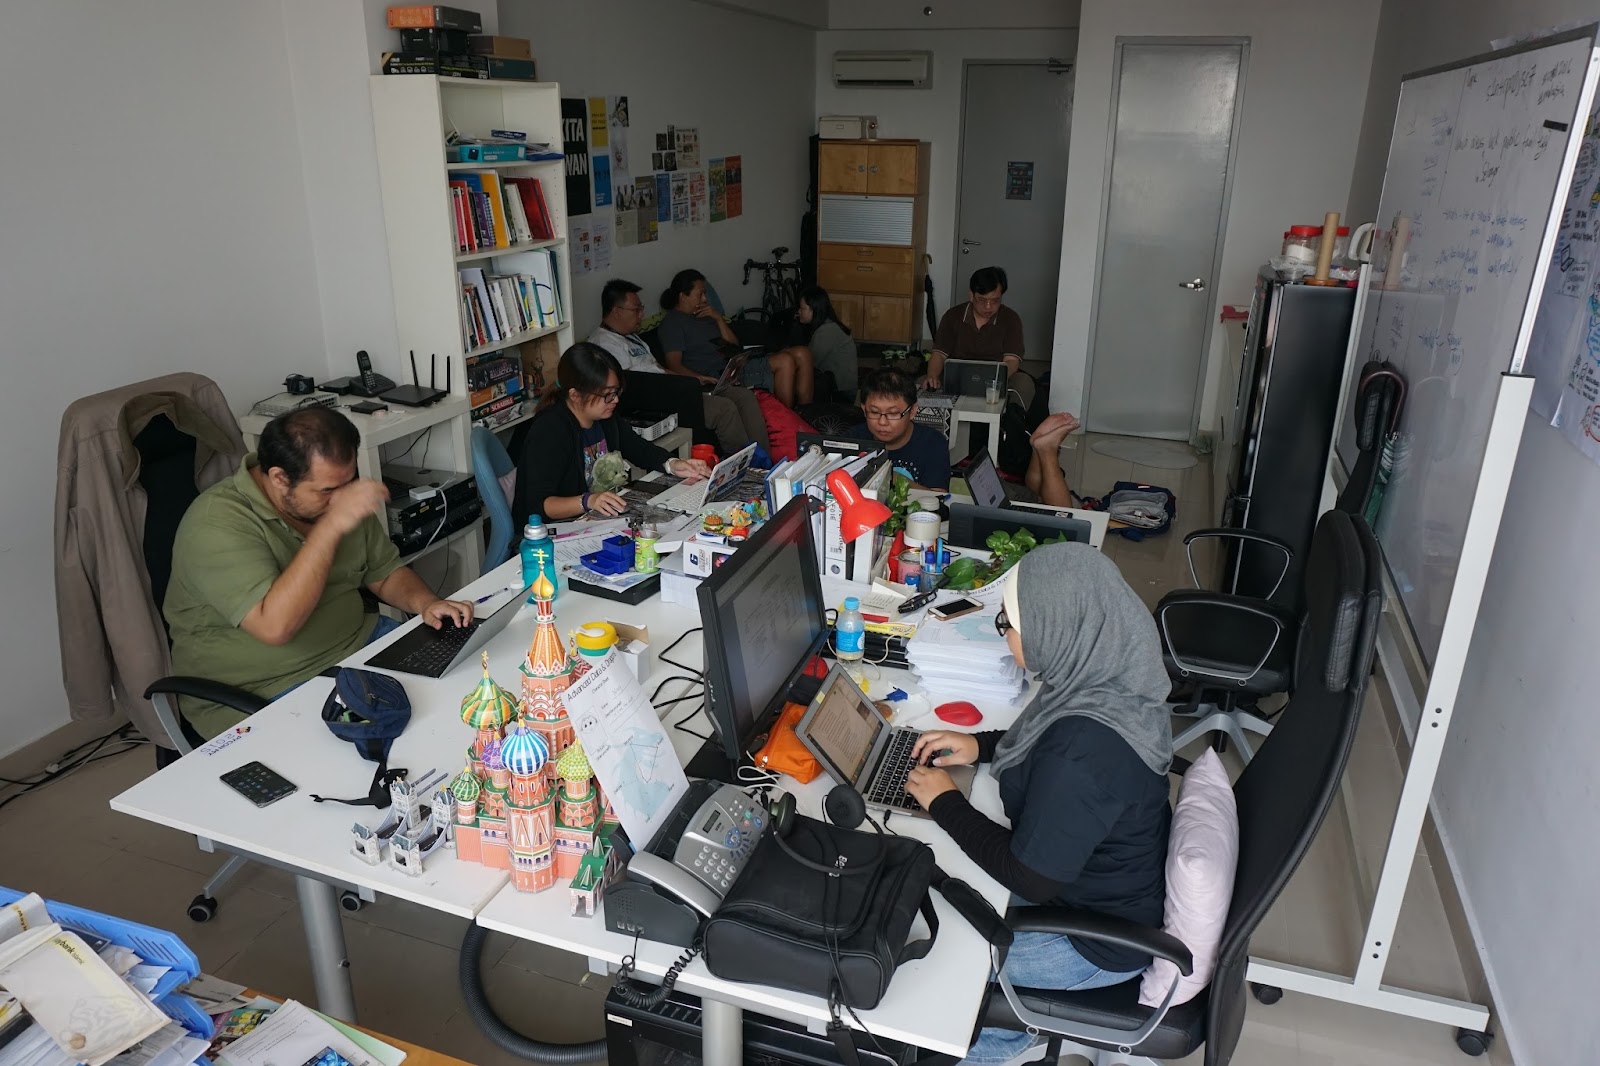
A data expedition are quests to explore uncharted areas of data and report back. The participants comprising several people with different skillsets throughout the day at the Sinar Project office, explored if there was data related to schools and clinics to see if there was data and analysis methods available to try gain insights on public service provision for education and health.
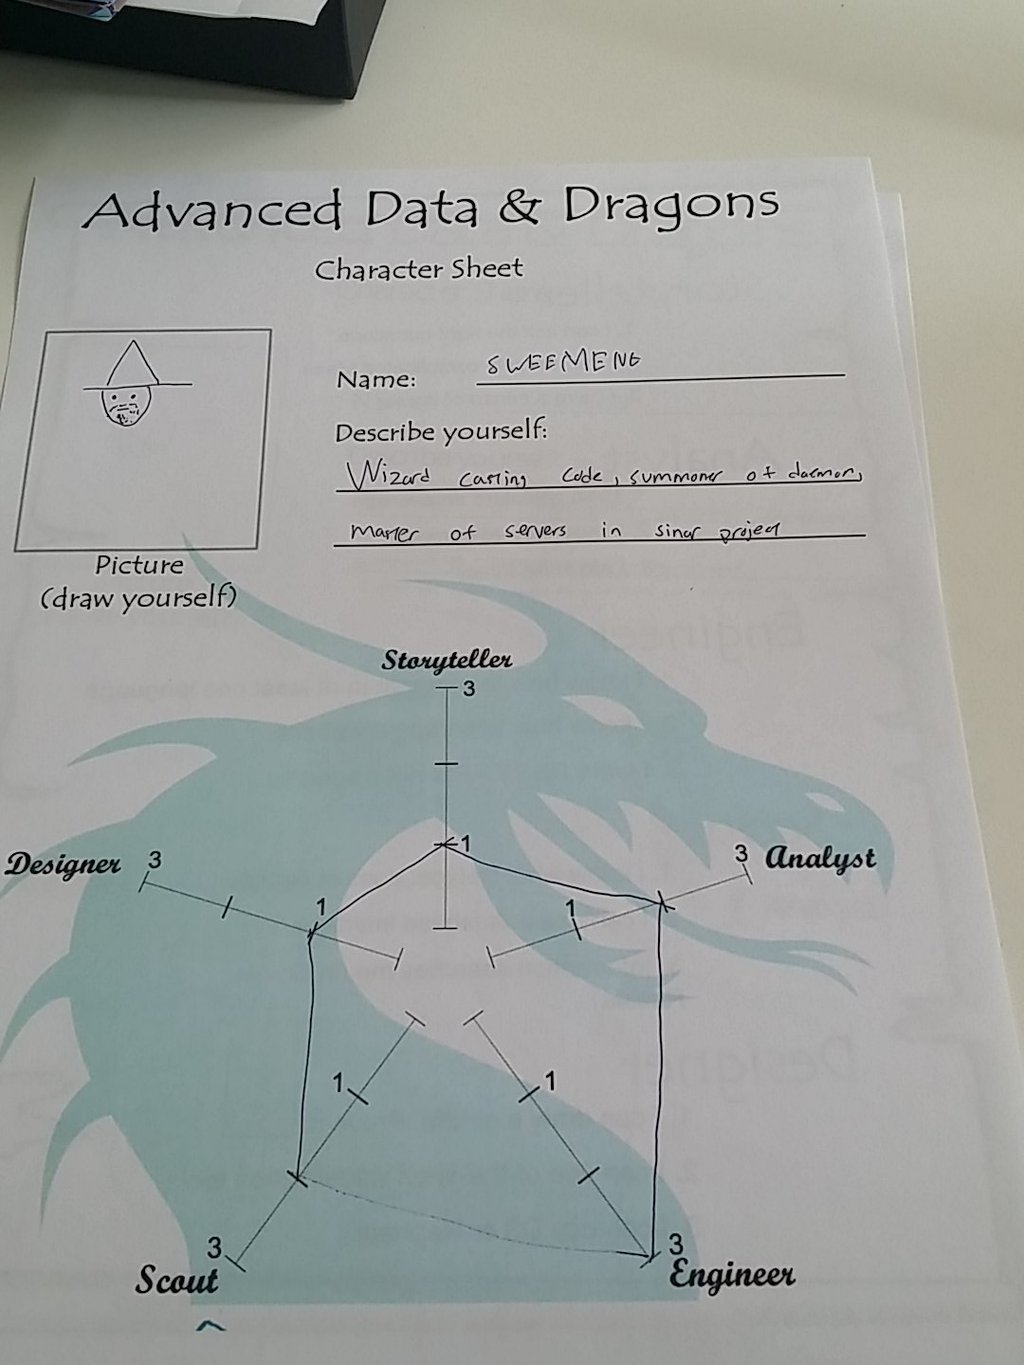
We used the guides and outlines for data expedition from the School of Data. The role playing guides worked as a great ice breaker. There was healthy competition on who could draw the best giraffes for those wanting to prove their mettle as a designer for the team.


Deciding what to explore, education or health?
The storyteller in the team, who was a professional journalist started out with a few questions to explore.
- Can we know if there are any villages or towns which are far away from schools?
- Can we know if there are any villages or towns which are far away from clinics and hospitals?
- How about population density and provision of clinics and schools?
The scouts then went on a preliminary exploration for whether data for this exists.
Looking for the Lost City of Open Data
Scouts with the aid of the rest of the team looked for data to be able to answer the questions, and found a lot of usable data from the Malaysian government open data portal data.gov.my. Lists of all public schools and clinics with addresses were found, as well as number of teachers for each district.
It was decided by the team that given the time limitation, to focus on trying to answer the questions on education data. An additional question was to also look for class sizes to see if schools are overcrowded or not.
Education
Open Data
- List of schools in Malaysia with addresses from Source: data.gov.my
- Number of Teachers for each education district (Selangor) Source: data.gov.my
- Bilangan PraSekolah or Pre-Schools in Terengganu Source: data.gov.my
- Direktori Pengendali Bas, Directory of School Bus Operators by registration numbers and by State Source: data.gov.my
- Keciciran Orang Asli ( Indigineous school dropout stats) Source: data.gov.my
Data in Reports
- Planning Report of Ministry of Education Document 2013 has some additional detailed stats, but not as open data
Definitions
- Not all schools are created equal, there are different types, some are considered as high achieving schools or Sekolah Berprestasi Tinggi
Health
Open Data
- Hospitals, with code, geolocation and address Source: data.gov.my
- List of malaysian gov dental clinic (Incomplete, Johor Only) Source: data.gov.my
GIS
- 1MalaysiaMaps
- Selangor PBT (Local Council) Admin Boundary Source: Tindak Malaysia
- Selangor PAR (Parliament) Electoral Boundary Source: Tindak Malaysia
- Selangor DUN (State Assembly) Electoral Boundary Source: Tindak Malaysia
- POI - http://data.gov.my/view.php?view=189
Other Data
- CIDB Construction Projects contains relevant information such as construction of schools and clinics
Budgets
Sinar Project had some budgets as open data, at state and federal levels that could be used as additional reference point. These were created as part of the Open Spending project.
Selangor State Government
http://data.sinarproject.org/dataset/selangor-state-government-2015-budget
Federal Government
Higher education
- https://docs.google.com/spreadsheets/d/1deOUIxWKWFeqPK51ioeHEE_rCiiNJ9UyZxCBZxw5Ab0/edit?usp=sharing
- http://www.treasury.gov.my/pdf/bajet/maklumat_bajet_kerajaan/2015/b64.pdf
- http://data.sinarproject.org/dataset/ministry-of-education-higher-education-budget-2015
Education
- https://docs.google.com/spreadsheets/d/1mVl0IEbOtwZHjSTg6OLRHjmtn_5sVrRzyTMztUQ6eDA/edit?usp=sharing
- http://www.treasury.gov.my/pdf/bajet/maklumat_bajet_kerajaan/2015/b63.pdf
- http://data.sinarproject.org/dataset/ministry-of-education-education-budget-2015
Methodology
The team opted to focus on seeing if they can work with the available datasets to answer the questions on education provision by first converting all school addresses into geocode, and then looking at joining up data to try find out relationships between enrollments, school and teacher ratios.
Joining up data
To join up data; the different data sets such as teacher numbers and schools, VLOOKUP function in Excel was used to join by Schoolcode.
Converting Address to geolocation (latlong)
To convert Address to Lat, Lng use the cleaned up address along with a geocoding tool like csvgeocode
./node_modules/.bin/csvgeocode ./input.csv ./output.csv --url "https://maps.googleapis.com/maps/api/geocode/json?address={{Alamat}}&key=<GOOGLE_GEOCODING_KEY>" --verbose
Convert the completed CSV to GeoJSON points
Use the csv2geojson
csv2geojson --lat "Lat" --lon "Lng" Selangor_Joined_Up_Moe.csv
To get population by PBT
Look at data from the state economic planning unit agency site for socio-economic data specifically the section Jadual 8
To get all the schools separated by individual PBT (District)
Take the GeoJSON of Schools data and PBT Boundaryloaded into QGIS; and use the Vector > Geo-processing > Intersect.
A top from Stack Exchange suggests it might be better to use Vector > Spatial Query > Spatial Query option.
Open Datasets Generated
The cleaned up and joined up datasets created during this expedition are made available on GitHub. While the focus was on education, due to the similarity in available data, the methods were also applied to clinics also.
https://github.com/Sinar/SinarODD2016
Visualizations
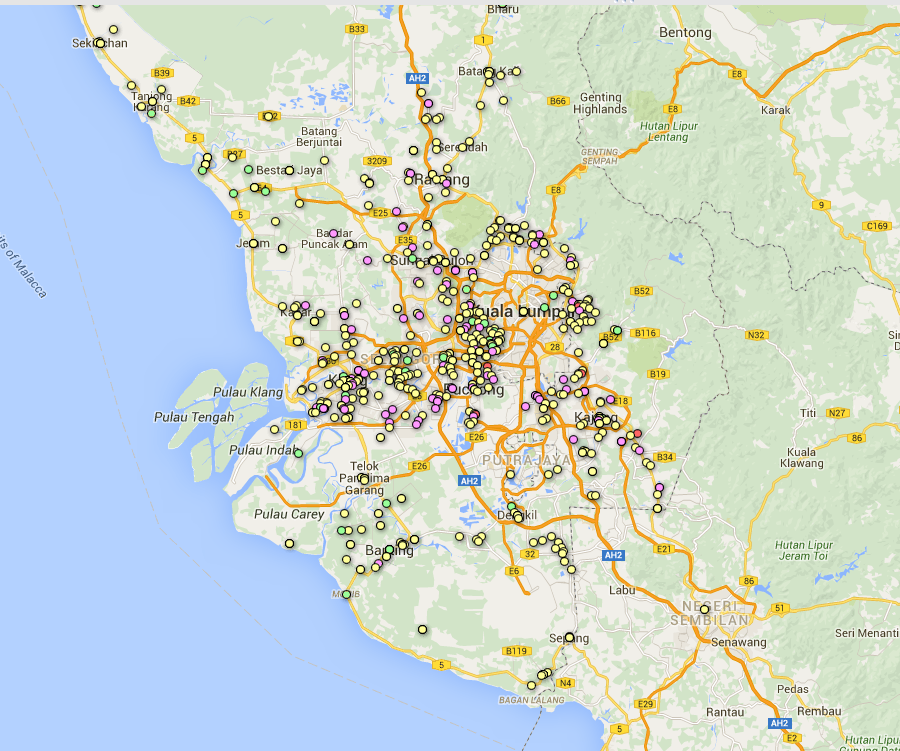
All Primary and Secondary Schools on a Map with Google Fusion Tables

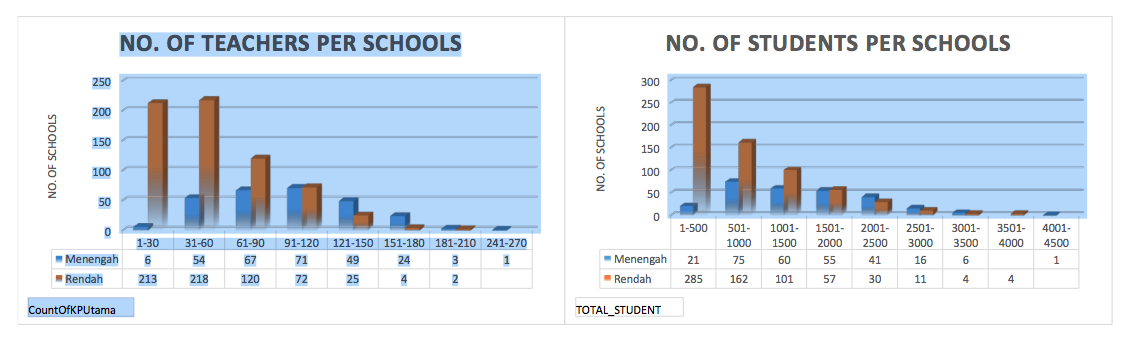
Teacher to Students per school ratios
Discovery
- Teachers vs enrollment couldn’t provide class sizes or data related to overcrowding
- Needed demographic datasets to measure schools to eligible population
- Needed more school datasets for teachers by subjects and class ratios
- Methods used for location of schools can also be applied for clinics & hospital data
It was discovered that additional data was needed to provide useful information on quality of education. There was not enough demographic data found to check against number of schools in a particular district. Teacher to student ratio was also not a good indicator of problems reported in the news. The teacher to enrollment ratios were generally very low with a mean of 13 and median of 14. What was needed was ratio by subject teachers, class size or against population of eligible children of each area, to provide better insights.
Automatically calculating distance from points was also considered and matched up with whether there were school bus operators in the area. This was discussed because distance from schools may not also be insightful for rural areas, where there was not enough children to warrant a school within distance policy. A tool to check distance from a point to the nearest school though could be built with the data made available. This could be useful for civil society to use data as evidence to prove that distance was too far or transport not provided for some communities.
Demographic data was found within local council boundaries, this could be used by others to match whether there was enough schools by local council boundaries. Interestingly in Malaysia however, education is under Federal government and despite having state and local bodies, these do not match up with local council boundaries or electoral boundaries. Administrative boundary data was made available as open data thanks to the efforts of another civil society group Tindak Malaysia which scanned and digitized the electoral and administrative boundaries manually.
Running future expeditions
This was a one day expedition so it was time limited. For running these brief expeditions we learned the following lessons.
- Focus and narrow down expedition to specific issue
- Be better prepared, scout for available datasets beforehand and determine topic
- Maybe working on central repository or wiki of available data may be a good idea to work on first, rather than go on expedition given that it is hard to find data in Malaysia
Appendix I: Re-use of the found and created datasets at Magic Data Analyst Course following day
One of the members of the team on the first day, applied additional tools and analysis for the data created during the open data day expedition.
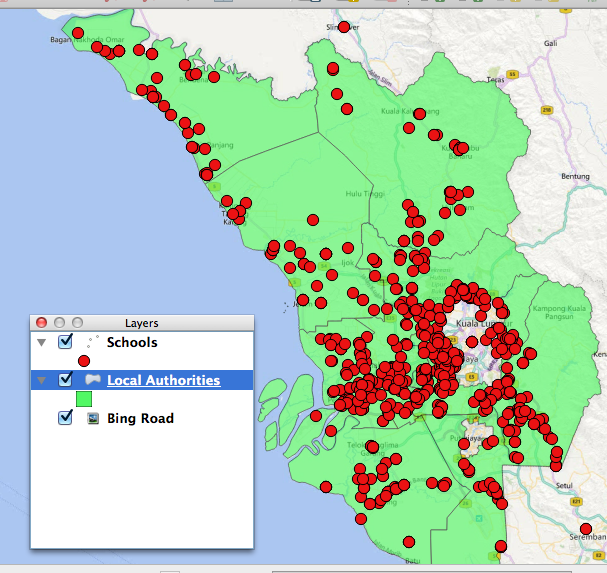
The objective was a continuation exploration to answer the questions posed during Open Data Day to discover which areas are underserved by schools. To analyze further, QGIS along with another open and freely released data set from another civil society organization Tindak Malaysia which was the Administrative Boundaries of the Local Authorities (PBT) in Selangor.
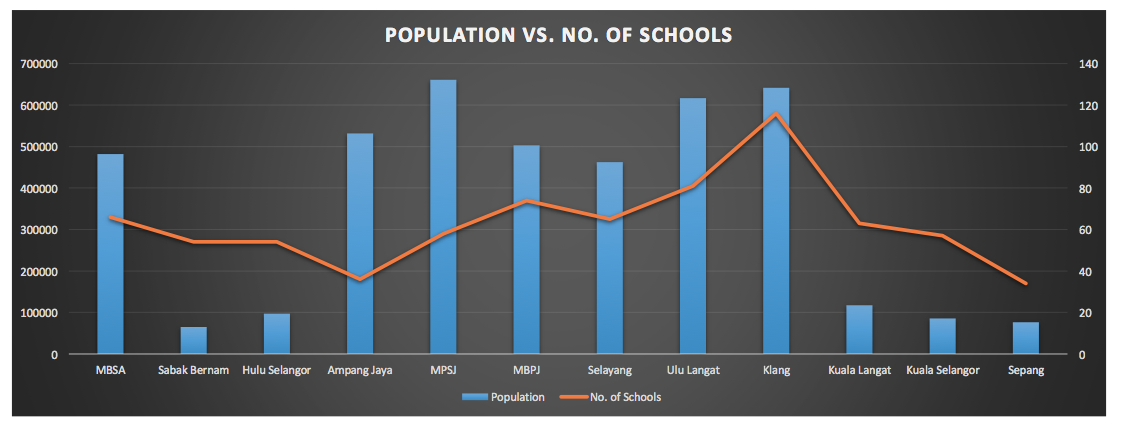
The goal was to separate out the schools by Local Authority as there was population data by Local Authority using the Vector Intersection analysis function in QGIS. After plotting out the data, we could see that Primary schools are much smaller in sizes but distributed more widely. High schools are more focused in urban areas and are of larger size.
Another observation on possible imbalance can be seen by comparing number of schools against local council borders Ampang Jaya (MPAJ) and Subang Jaya (MPSJ) for urban areas; and Sabak Bernam, Hulu Selangor for semi-urban areas. The data shows that there are more schools in semi-urban areas against population, but it also shows that are also some discrepancies in school distribution between different urban areas with similar population numbers. It would seem that a minimal school distance to communities may be in place. A proper conclusion would likely need further segmenting as urban/rural distribution will need to be taken into account.